


Photo by John Schaidler on Unsplash
Supervised Learning: Introduction to Linear Regression!
A proven way to scientifically and reliably predict the future.


Table of contents

No headings in the article.
What is Linear Regression?
Over 100 years old, linear regression is a linear technique for modeling relationships between two types of variables. One is called the predictor x or the independent variable and the other is the prediction, the response or the dependent variable y
What is it used for?
Linear regression analysis is used to predict the value of a variable y based on the value of another variable x.
A classic example is if you want to estimate the salary of an employee based on years of experience. You have the recent company data, which shows the dependency of salary on years of experience.
In this case, year of experience is an independent variable, and the salary of an employee is the dependent variable
How does it work?
Linear regression is a simple statistical regression technique used in predective analysis that shows the relationship between the continous variables. It shows the linear relationship between the independent variable x and the dependent variable y.
If there is a single input variable (x), such linear regression is called simple linear regression. And if there is more than one input variable, such linear regression is called multiple linear regression.
The linear regression model gives a straight line that describes the relationship between the two variables x and y.
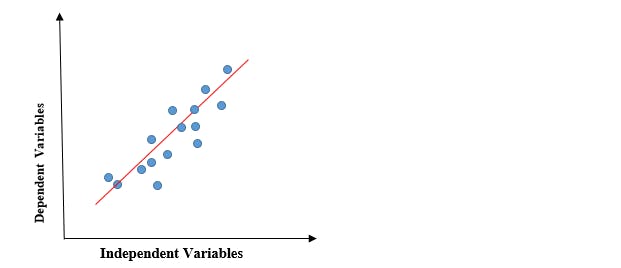
The graph above shows a representation of a relationship between the x-axis values and the y-axis values. As the x-axis values increase, the y-axis values also increase. The red line is the regression line and it defines a mathematical equation that describes the relationship between these two continous variables.
The mathematical equation is a straight line formula. Which is very familiar if you have a high school math background
y = mx t c
y is the prediction or the dependent variable
m is the slope or the bias-coefficient
x is the independent variable
c is the y-axis intercept. It is the value of y when x is equal to 0
Cost Function
The cost function helps to figure out the best possible values for c and m, which provides the best fit line for the data points.
The cost function optimizes the regression coefficients or weights and measures how a linear regression model is performing. The cost function is used to find the accuracy of the mapping function that maps the input variable to the output variable. This mapping function is also known as the Hypothesis function.
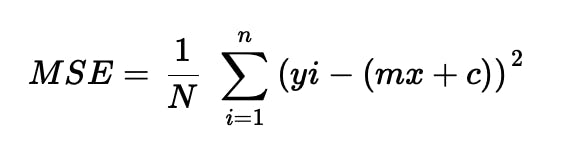
In Linear Regression, Mean Squared Error (MSE) cost function is used, which is the average of squared error that occurred between the predicted values and actual values.
By simple linear equation y=mx+c we can calculate MSE as:
Given y = actual values, yi = predicted values
Using the MSE function, we will change the values of c and m such that the MSE value settles at the minima.
The coefficients that give us the minimum squared error will be the one that gives best line of fit and therefore the one that can predict to the best accuracy the value of y with respect to a value of x
Applications
- Generation of insights on consumer behaviour in business
- Comprehension of factors affecting profitability
- Evaluating trends and forecasting production in agriculture based on amount of rainfall
Summary
The goal of the linear regression algorithm is to get the best values for c and m to find the best fit line and the best fit line should have the least error.
This model or tuned equation can then be used to determine more accurately the value of the dependent variable y given a certain value of x hence prediction. Pretty cool right?